How Public Transport Growth Drives Real Estate Value in different types of U.S. Cities (2010-2023)
- John Lee
- Aug 24, 2024
- 3 min read
Updated: May 21

Investing in real estate requires a keen understanding of various factors that contribute to property value and desirability. One such critical factor is the availability and efficiency of public transportation. This article series aims to provide insights into public transport usage and service levels across key urbanized areas in the United States, serving as a valuable resource for real estate investors and developers.
In this final installment of our series, we delve deeper into the analysis of public service supply, and housing price changes between 2010 and 2023. This analysis aims to provide a more profound understanding of how changes in public transport infrastructure have influenced housing prices over the past decade. Our study focuses on 228 urbanized areas in the U.S. where complete data on Vehicle Revenue Miles (VRM) and overall housing prices from 2010 to 2023 are available.
Overall, public transport usage in U.S. cities has been on a downward trend since 2010. Our analysis reveals that from 2010 to 2023, the total UPT (Unlinked Passenger Trips) across U.S. cities declined by approximately 29.41%, while the total VRM (Vehicle Revenue Miles) decreased slightly by about 1.48%. During the same period, the average VRM per capita remained relatively stable, with 13.38 per capita in 2010 and 13.34 per capita in 2023. This suggests that the changes in VRM were more pronounced in smaller cities rather than in larger urban areas. Meanwhile, housing prices have seen a significant increase of about 94.98%.
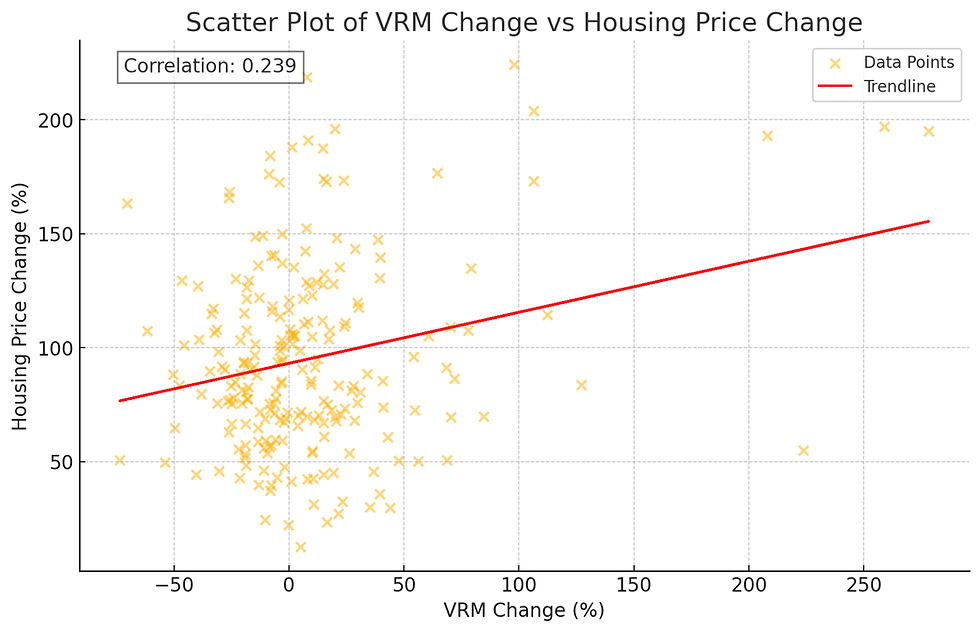
Does VRM change correlate with housing price change? Yes, it does. A correlation analysis across all cities reveals a significant positive correlation of 0.24 at the 99% confidence level between VRM changes and housing price changes.
The slower VRM growth in large cities compared to smaller cities could be attributed to the fact that, by 2010, many large cities had already established well-developed public transportation systems. This context led us to categorize the 228 cities into four groups based on the median VRM per capita in 2010 and the changes in VRM from 2010 to 2023.
Group | VRM per Capita in 2010 | VRM Change 2010-2023 | Population 2020 | VRM Change | Housing Price Change | VRM per Capita in 2010 | VRM per Capita in 2023 |
1 | Low | Low | 453,532 | -17.27 | 84.86 | 7.66 | 6.10 |
2 | Low | High | 475,509 | 41.81 | 98.25 | 7.23 | 9.51 |
3 | High | Low | 1,365,499 | -19.51 | 91.87 | 19.07 | 14.71 |
4 | High | High | 1,191,631 | 24.49 | 104.88 | 19.77 | 24.21 |
Total | 880,991 | 8.11 | 94.98 | 13.38 | 13.34 |
Groups 1 and 2, characterized by lower VRM per capita in 2010, tend to consist of smaller cities, while Groups 3 and 4 include larger urban areas. The average VRM per capita in Groups 1 and 2 is similar, as is the case for Groups 3 and 4. However, the 2023 VRM per capita shows a significant divergence, reflecting 13 years of growth. Notably, cities in Group 2 increased their VRM by an average of 41.81% over this period but still lag behind the levels seen in Group 3.
The cities in Groups 2 and 4, which experienced significant VRM growth, also recorded higher housing price increases compared to Groups 1 and 3 and the overall average. Particularly, Group 1, where both VRM per capita in 2010 and VRM change were low, saw a notably lower housing price appreciation.
Does the impact of increased VRM on housing prices vary with existing public transportation levels? Yes, it does. This is a logical outcome when considering diminishing marginal utility in services. The charts below illustrate the correlation between VRM change and housing price change for Groups 1 & 2 (low VRM per capita in 2010) and Groups 3 & 4 (high VRM per capita in 2010). Groups 1 & 2 (low VRM per capita in 2010) exhibited a correlation of 0.37 between VRM change and housing price change, a significant result at the 99% confidence level. on the other hand, Groups 3 & 4 (high VRM per capita in 2010) showed a very low correlation between these two variables, and the results were not statistically significant.
These findings suggest that in cities with less developed public transportation infrastructure, additional VRM growth can have a more significant impact on housing prices. Conversely, in cities with already well-established public transportation systems, the effect of further VRM increases on housing prices may be less pronounced or even negligible.
Our analysis confirms that the expansion of public transportation services plays a crucial role in determining housing prices. Specifically, cities with less developed public transport infrastructure are more likely to experience significant housing price increases with additional service expansions. Public transportation directly influences housing demand, thereby affecting property values.
In cities with underdeveloped public transportation, additional infrastructure investments can enhance residents' mobility, likely leading to increased housing demand and higher property prices. This trend is especially noticeable in suburban areas of major cities, where accessibility to public transit is closely linked to quality of life.
In well-developed cities, while the impact of improving existing infrastructure on housing prices may be smaller, it remains an important factor. For example, expanding transit routes or improving service quality can stimulate housing demand and drive up prices.


Comments