
Which U.S. Cities Are Showing Mortgage Stress?
- Dennis Lee
- Sep 17, 2025
- 2 min read


Mortgage stress is creeping back into the headlines. While overall delinquency rates are still historically low, some metros are flashing early warning signs. The real story isn’t just who’s high right now—but who’s rising fastest.
With the growing expectations for a rate cut in September, it’s a timely moment to take a closer look at which U.S. metros are seeing the fastest rise in 30–89 day mortgage delinquencies. Based on the National Mortgage Database, delinquency rates started to trend upward in April 2021 and have now reached around 2%. While this is still low compared to the Global Financial Crisis period, it is interesting to see which cities are experiencing relatively faster increases.

Below is the December 2024 snapshot of Mortgage Delinquency Rates (30–89 days) across the 50 largest MSAs. Notable observation: Florida, Many MSAs on the west, and New York metros generally show low delinquency rates.
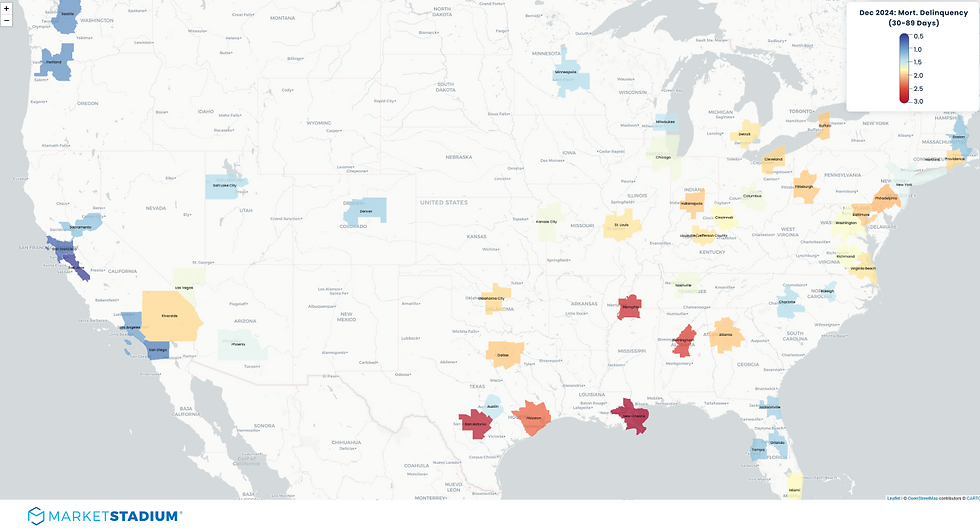

However, when looking at the 1 year average of YoY change, the picture shifts: Florida markets show some of the highest growth rates, while places like Houston and major coastal metros (East & West) exhibit relatively muted increases.


And finally, we mapped major U.S. MSAs by current delinquency rate (Dec 2024) and average YoY change over the past year.

Quadrant Summary:
🔵 Q1 (High Current · Rising Fast)
Markets with both high delinquency levels and strong upward momentum → clear red flags.
Examples: Atlanta, Baltimore, Birmingham, Miami, New Orleans
🟢 Q2 (Low Current · Rising Fast)
Currently stable but deteriorating quickly. Watch for potential risk ahead.
Examples: Austin, Chicago, Las Vegas, Orlando, Phoenix
🔴 Q3 (Low Current · Low Growth)
Relatively safe markets with low delinquency and stable trends.
Examples: Boston, New York, Los Angeles, Seattle, San Diego
⚫ Q4 (High Current · Stabilizing)
High delinquency but no longer accelerating – could indicate structural issues or early recovery.
Examples: Cleveland, Detroit, Houston, Dallas, St. Louis
👉 In short:
Q1 metros (e.g., Miami, New Orleans, Philadelphia) and Q2 metros (e.g., Austin, Phoenix, Orlando) warrant closer monitoring. Q3 metros appear relatively resilient, while Q4 metros reflect legacy stress with some tentative stabilization.

Want deeper quadrant insights or submarket breakdowns? Click the Book Demo button in the top navigation bar for a personalized walkthrough.
Explore our Product page or walkthrough website anytime for more info on features we provide!

Dennis Lee
CEO at Market Stadium
Prev. Lionstone Investments Research Team


Comments